Inserting data in workbook

I need to insert rows in worksheet with a specific format to be loaded to sql server. This is code in Sql server that needs to be
DECLARE @LoopCounter INT = 1
WHILE ( @LoopCounter <= 17)
BEGIN

INSERT INTO [dbo].[Load_RCM_OS2_Mtg_Daily_Report]
           ([Sample Number]
           ,[Reporting Transit]
           ,[QuarterYear]
           ,[PC Code]
           ,[Report Date]
           ,[Transit Tested]
           ,[date_loaded]
           ,Snap_Dt)
     VALUES
           (@LoopCounter,3753,32020,NULL,NULL,NULL,'2020-04-30','2020-04-30')
    SET @LoopCounter  = @LoopCounter  + 1
END

How to duplicate the rows in Datameer. I created one row in Sheet1 manually but need help in repeating it 17 times-

Hello Bhupinder.
I hope you are doing fine.
The conception of a Workbook does not intend manual data insertion. Usually one brings a dataset into Datameer via a FileUpload, an ImportJob or a DataLink and then loads this data into a Workbook for further analysis and transformation.While it is possible to generate data in a Workbook without external sources, one can't create an empty column of a certain data type. First, it is required to generate value and then transform this value as needed.
In case I properly understand your use-case, you need to generate some data under a certain format. So, you could try the following approach.
- Create a new Workbook.
- In column A:
- Add function EXPLODE_RANGE(1;20) - it creates 20 records of integers from 1 to 20.
- Rename the columns to SampleNumber.
- Column B
- Add function INT(RANDBETWEEN(2000;5000)) - it generates a random integer value between 2000 and 5000 for every record.
- Rename the columns to ReportingTransit.
- Column C
- Add function INT(RANDBETWEEN(20000;50000)) - it generates a random integer value between 20000 and 50000 for every record.
- Rename the columns to QuarterYear.
- Columns D, E, F
- Add function IF(#QuarterYear == 0; 25; null) - it generates null values for every record, as the condition always false. Note the type of the column will be INTEGER, as THEN part is an integer (25).
- Rename the columns to PC_Code, ReportDate, and TransitTested accordingly.
- Columns G and H
- Add function NOW() - it generates current time and date value for every record. The column type is DATE.
- Rename the columns to date_loaded and Snap_Dt accordingly.
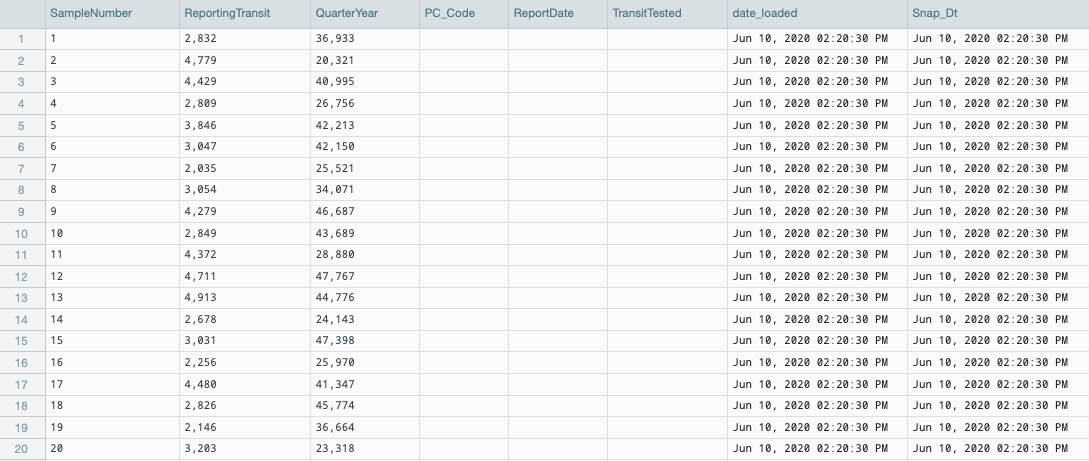
After these manipulations, you should get the following Sheet in the Workbook.
However, I guess it is much easier to create the desired schema with sample records in a CSV file and ingest it into Datameer.
Please let me know if you will have any further questions.
-
Thankyou for the code
QuarterYear should be dynamic usign the following logic from sql server
(SELECT CAST(CASE WHEN month(getdate()) in (9,10,11) THEN 1  --12020 is availability date Oct/Nov/Dec 2019
                                                    WHEN month(getdate()) in (12,1,2) THEN 2 --22020 is availability date Jan/Feb/Mar 2020
                                                    WHEN month(getdate()) in (3,4,5) THEN 3  --32020 is availability date Apr/May/Jun 2020
                                                    WHEN month(getdate()) in (6,7,8) THEN 4  --42020 is availability date Jul/Aug/Sep 2020
                                                    END as Varchar(2)) + CAST(CASE WHEN month(getdate()) in (10,11,12) THEN Year(Getdate())+1 ELSE Year(Getdate()) END as varchar(4)))
I have create the following formula seems complex and was if it could be simplified
CONCAT(T(CASE(0;month(NOW());9;1;10;1;11;1;12;2;1;2;2;2;3;3;4;3;5;3;6;4;7;4;8;4));T(CASE(YEAR(NOW());MONTH(NOW());10;YEAR(NOW())+1;11;YEAR(NOW())+1;12;YEAR(NOW())+1)))
-
Hello Bhupinder.
In most of the cases, there is no good or bad formula for Datameer. The key is accuracy - in case the formula you created is 100% accurate and returns desired results, you are good to go.I've represented the same logic as a set of nested IF functions and got the same results.
IF(MONTH(#Date)>2 && MONTH(#Date)<6;T(3)+YEAR(#Date);
   IF(MONTH(#Date)>5 && MONTH(#Date)<9;T(4)+YEAR(#Date);
     IF(MONTH(#Date)>0 && MONTH(#Date)<3;T(2)+YEAR(#Date);
       IF(MONTH(#Date)>9 && MONTH(#Date)<12;T(1)+(YEAR(#Date)+1);
         IF(MONTH(#Date)==9;T(1)+YEAR(#Date);
           IF(MONTH(#Date)==12;T(2)+(YEAR(#Date)+1);null))))))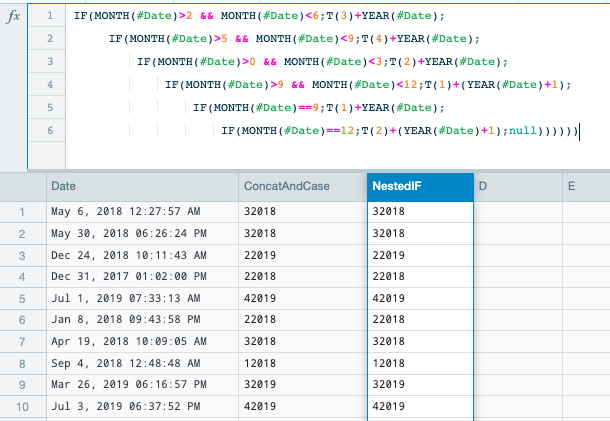
Please sign in to leave a comment.
Comments
4 comments